“Everything should be made as simple as possible, but not simpler” – Albert Einstein
Data visualization is an effective tool for several reasons–it makes your data digestible and easy to interpret so that you can create actionable takeaways. It also helps to build awareness around company, team and individual goals and gives your employees clear insights into what is expected of them. And according to a Gallup report, employee engagement stems from several key basic needs in the workplace including knowing expectations and visualizing and discussing progress. Thus, data visualization and goal awareness go hand-in-hand.
Here are some of our top tips:
Use a Company Dashboard
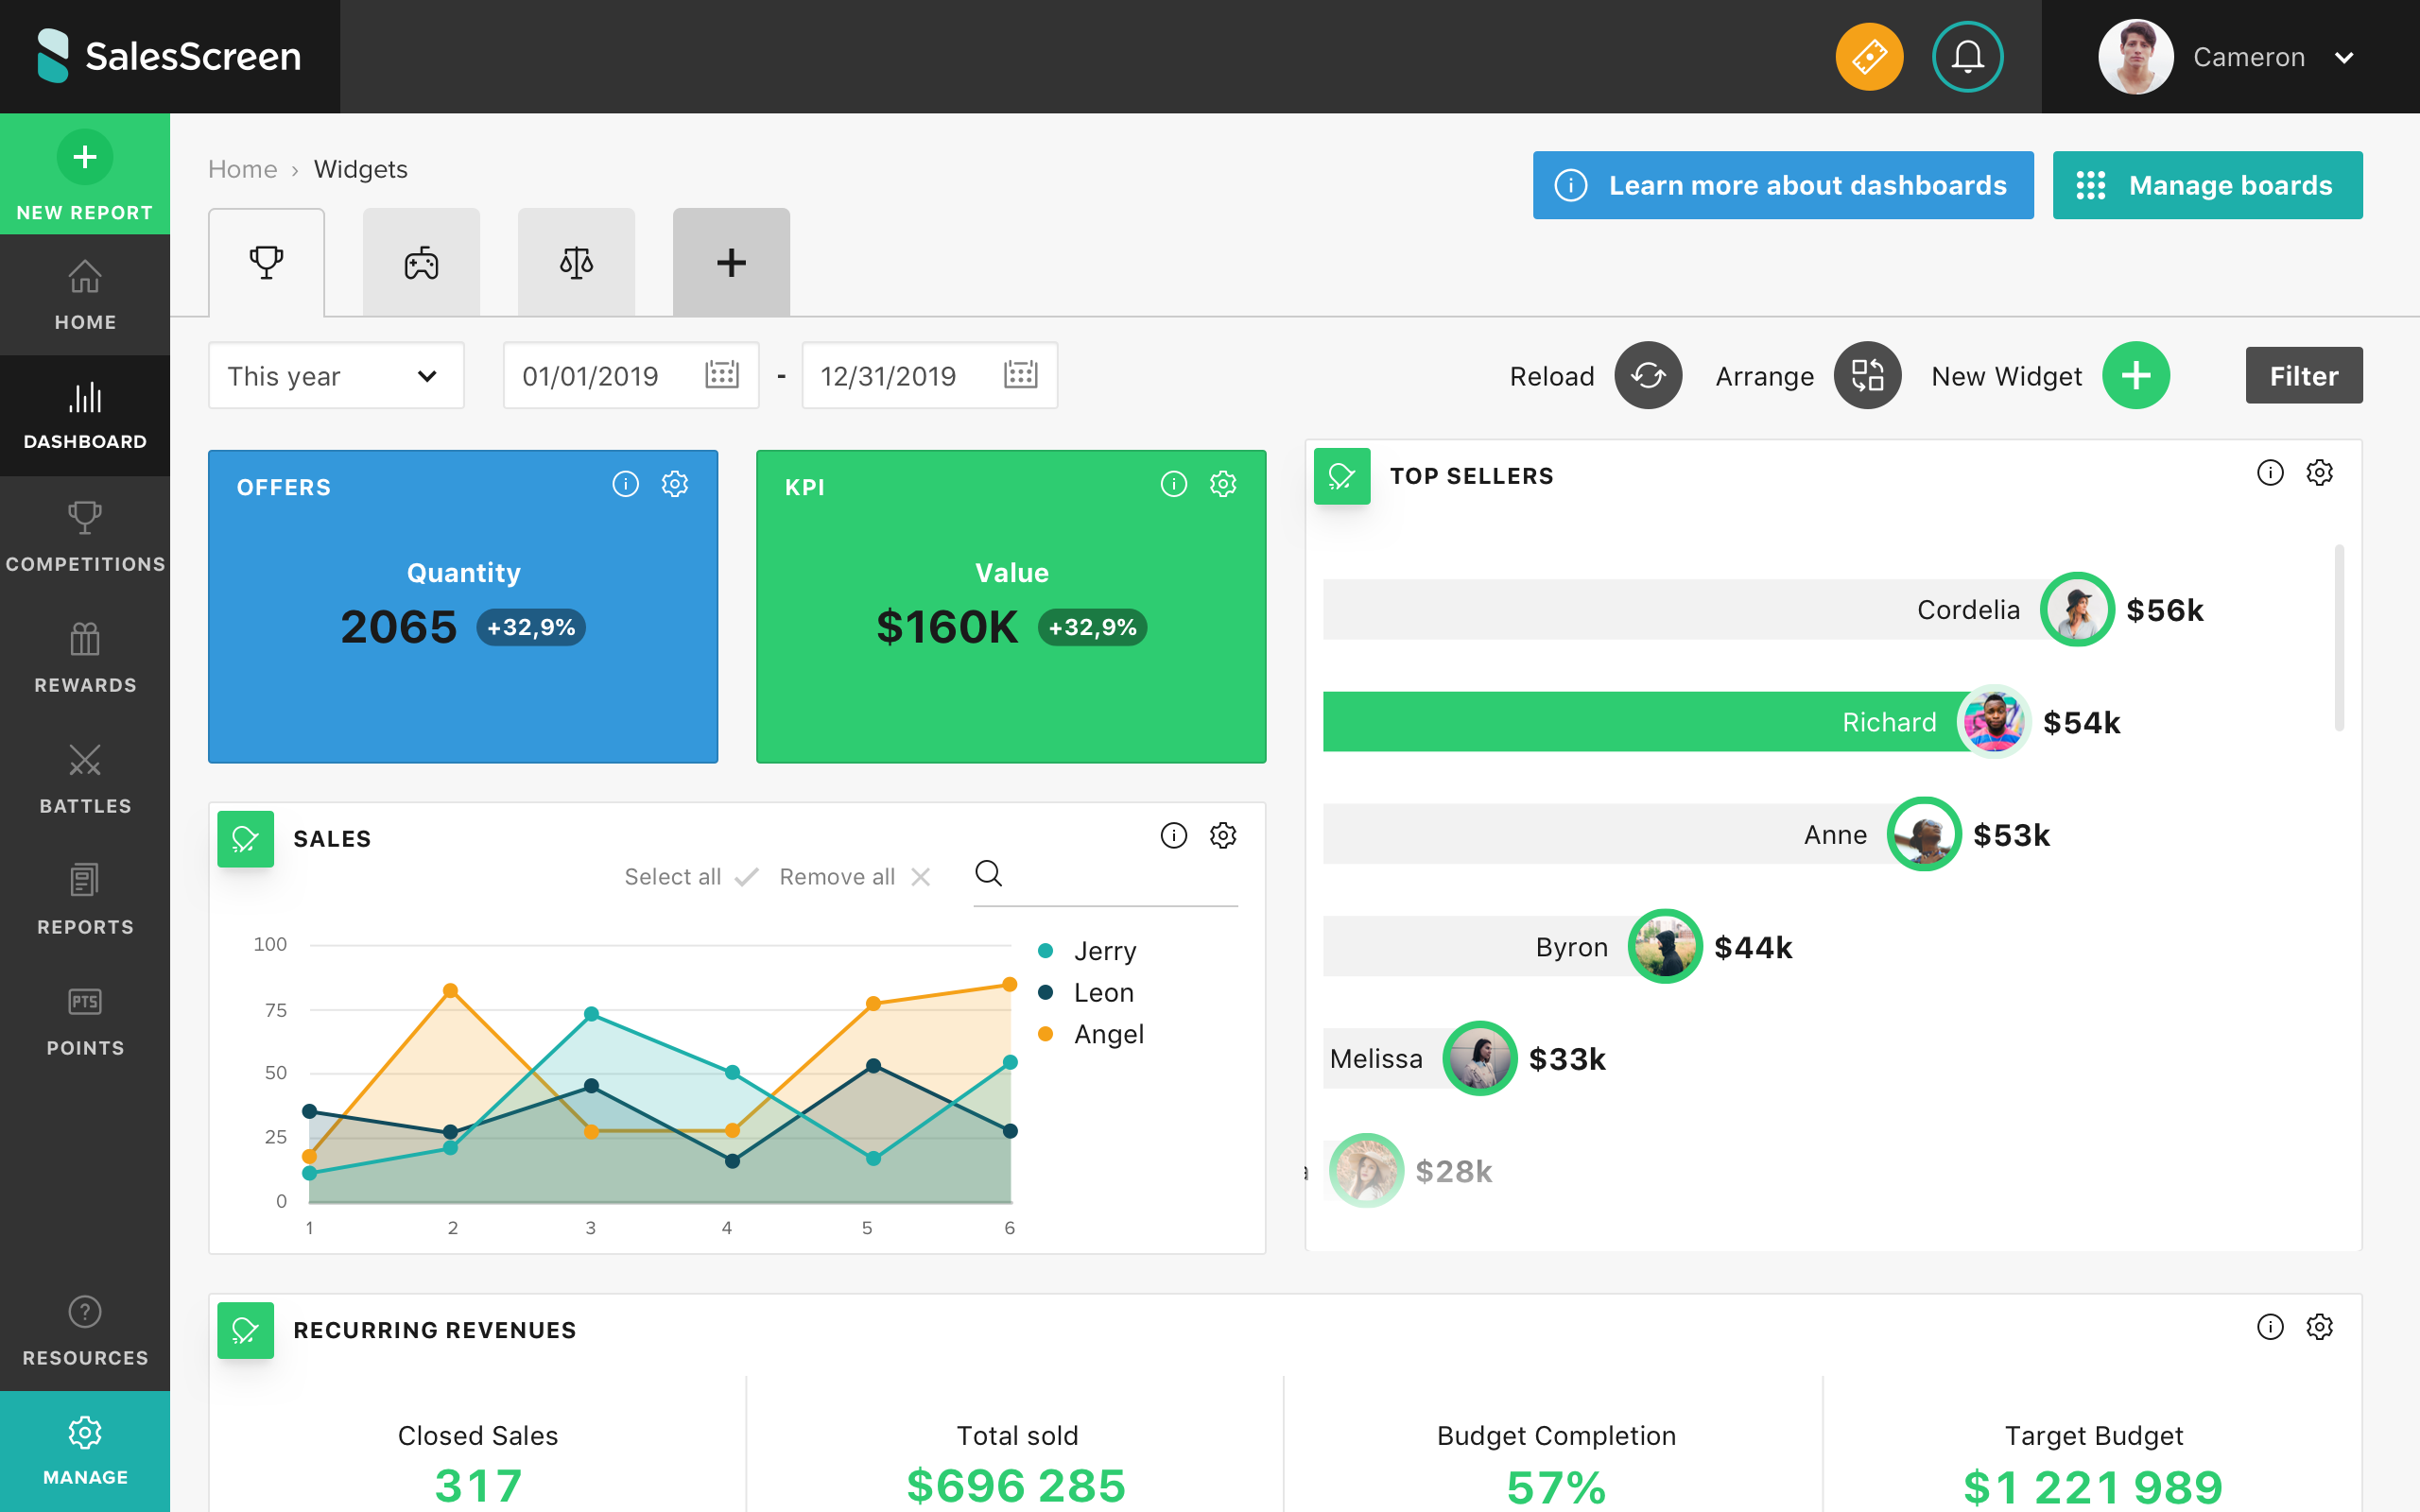
A company dashboard is a simple, effective way to display your data. It’s visual and intuitive, and it makes it easier than ever to show progress on current goals and ensure that your team is focused on the metrics that matter most to your business. You can also customize and present your data in virtually any shape or form in real-time, so that everyone is always in the loop.
When creating your company dashboard, here are a few things to keep in mind:
- Create separate boards for different departments, metrics, etc. \t* Examples: personal dashboard, marketing, sales, forecast, pipeline
- Choose the right style widget for the right metrics \t* Example: budget progress might be best as a percentage progression chart, while leaderboards might be best displayed as a highlighted toplist

Display Data on TV Screens
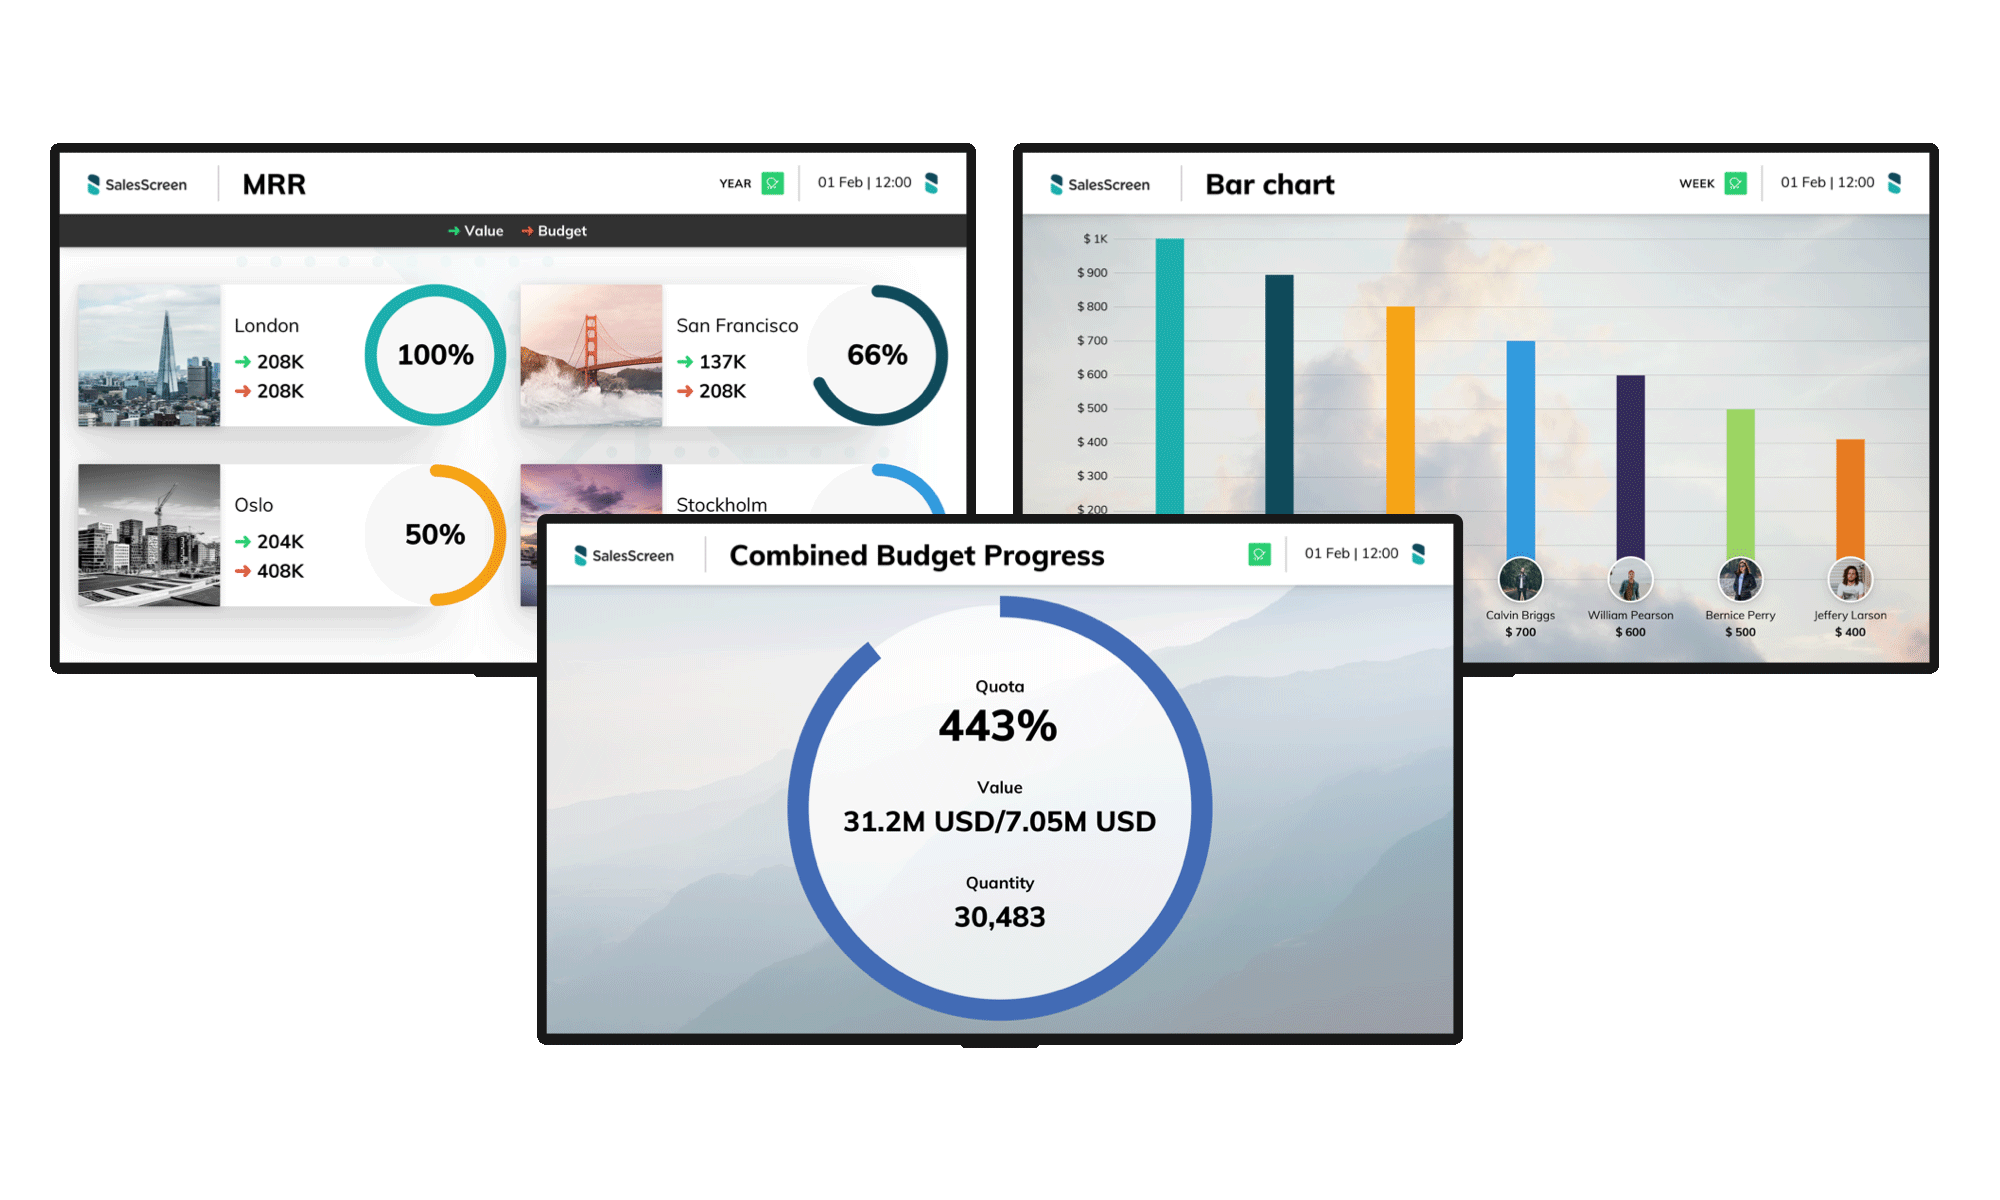
In addition to the dashboard, you can also show your data in real-time via slides on TV screens throughout your office(s). This not only contributes to building a more open, transparent work environment, but it also leads to an increase in employee awareness and motivation. When people are informed, purpose-driven and feel like they are making an impact, they are much more likely to work harder and experience more job fulfillment–studies show that “purpose-oriented employees experience 64% higher levels of fulfillment in their work compared to non purpose-oriented employees.”
Showing leaderboards is another method for visualizing goal progression. It helps to keep everyone engaged and motivated to crush their targets–and their co-workers’ top spot. For some ideas on what types of leaderboards to use, check out this blog on our 5 favorites.

Celebrate Achievements
TV screen celebrations are an additional feature for increasing goal awareness. Whenever someone hits their monthly target, breaks a sales record or achieves any other important milestone, an event is triggered to show a pop-up on your office TV screens. This can be accompanied by a personalized YouTube video to draw even more attention and ensure that events worth celebrating–like goal attainment–never go unnoticed.

…
Want to know more? Check out our free infographic, Fascinating Statistics About Data Visualization
Do you have any insights on data visualization and goal awareness? Send them our way to marketing@salesscreen.com


